Worker's Schedule Optimization
Worked directly with the CTO of Sydney’s leading online platform for home cleaning services to develop efficient schedules for cleaners that minimized travel time and distance between jobs using shortest-path optimization algorithms and the Google Maps API. I also studied customer satisfaction and churn rates using Decision Trees with Bagging, Random Forest, Boosting, Logistic, and K-Nearest Neighbors models.
TidyMe: an Uber for home cleaners
TidyMe is an online platform connecting experienced cleaners with people wanting their house or workplace cleaned weekly, biweekly, or monthly. The company was founded in July of 2014 and is based out of Sydney, Australia with operation expanding to Melbourne and Brisbane.
In the fall of 2016, I worked with TidyMe for my final project in the Data Science Immersive course through General Assembly. As a group project, my class analyzed churn rates to look at why customers were leaving and from those results I decided to take on a project of my own working to optimize cleaner’s schedules by reducing time and travel distances between jobs.
Churn Analysis
The analysis was split into two parts: looking at the reason customers who had their house cleaned were leaving the service and the reason the house cleaners were leaving. After initial cleaning and visualization of the data, we fit seven different grid-searched models and used feature selection on the best models to find the features with the highest importance in determining retention rate.
Initial exploratory analysis began with a Seaborn pair-plot to find any visual trends between the 30 features in the data with the boolean account-deleted variable or the dates leading up to the customers inactivity. Features were narrowed down to the marketing first touch, age of the customer, price scheme, number of cleaners on the job, any dates a whole job was canceled, and the dates of any specific weekly or biweekly clean that was canceled or postponed.
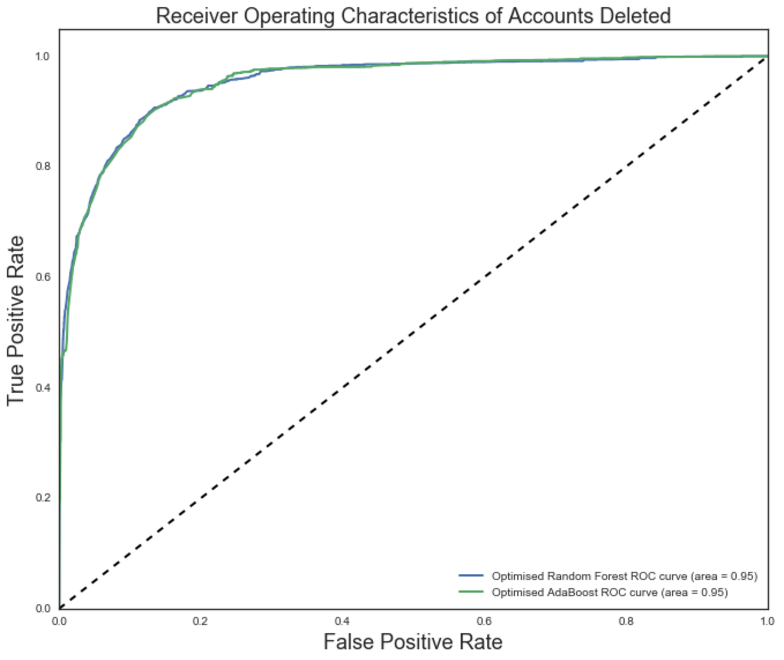
After building several models with grid searched parameters and comparing them with the Dummy Classifier, the most accurate models turned out to be AdaBoost and a Random Forest with Bagging. Both models yielded an area of 0.95 under their Receiver Operating Characteristic curve. Feature performance was then used to determine that age of the customer and price of the clean were the best predictors of customer churn.
A similar process was used to analyze why cleaners were leaving the service which showed long distances and waiting periods between jobs have a high correlation to cleaner churn. After the results of this analysis were presented, TidyMe wanted me to focus on optimizing the schedules of cleaners so the number of cleaners leaving the service may be reduced.
Cleaner Schedule Optimization
The online platform for the cleaners includes a monthly schedule where the user can pick which jobs they want to do in their area. The interface was set up to show only the name of the customer and the time for the clean. It did not show locations so job schedules ended up being inefficient and inconvenient for the cleaners leading to unhappy cleaners who eventually left the service. When cleaners leave the service or even just cancel a job, this leaves jobs unassigned so admin must call around to other cleaners to fulfill the clean last minute. The unassigned jobs and last minute scheduling leave no customer to cleaner relationships being built which is essential in building great customer service and growing a business that relies on referral.
I set up my model as an optimization problem to minimize time and distance between jobs so that the cleaner’s schedules are as efficient as possible. The data is pulled from a database storing customer and cleaner information, availability blocks in cleaner schedules, cleaner’s existing assigned jobs, and the occurrences for all the jobs scheduled on the platform. The jobs were recorded as “jobs” which referred to the ongoing clean for a customer and “occurrences” which are the individual cleans each week or every other week so for a given month there might be one, two, or four occurrences for each job. Several constraints needed to be considered including making sure a cleaner was not paired with a customer who had previously requested not to work with that particular cleaner and ensure a cleaner was not scheduled for a clean that took place after their visa had expired since many of the cleaners were on student travel visas.
Dijkstra’s Algorithm
When I first looked at this project I experimented using linear programming to set up the optimization but the multitude of possible schedules proved difficult to represent with a system of linear equations. I eventually decided to structure my problem as a shortest path model specifically using Dijkstra’s algorithm. The algorithm finds the shortest distance through a collection of vertices between the designated initial node and target node. Each vertex is connected to the graph by a weighted edge representing the distance to that vertex. Dijkstra’s algorithm is used as follows:
- Assign to every node a temporary distance value of infinity except for the initial node which is set to zero.
- Mark all nodes as unvisited and set the initial node as the current node.
- Consider all of the current node’s unvisited neighbors and calculate their temporary distances by adding the corresponding edge value to the distance of the current node. Compare the newly calculated temporary distance to the originally assigned value and assign the smaller of the two.
- When all neighboring nodes to the current node have been checked, mark the current node as visited and select the unvisited node that is marked with the smallest temporary distance as the new current node. If the target node has not been reached, go back to step 3.
Simple Example
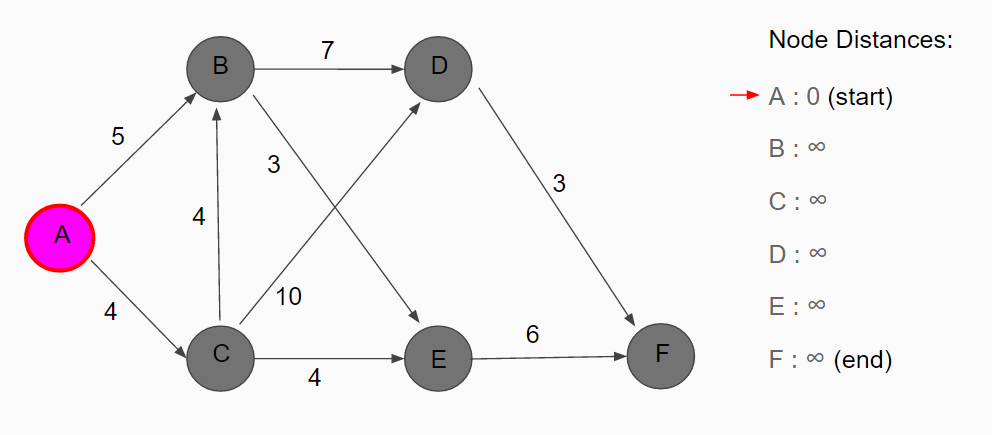
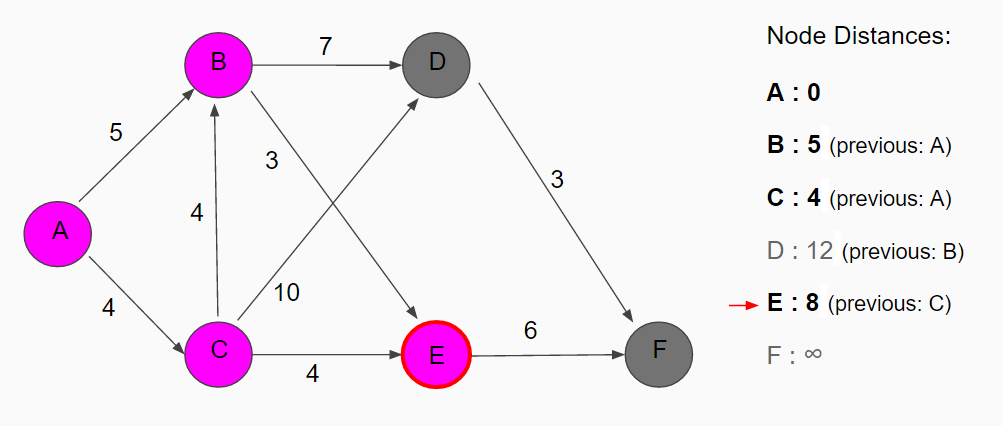
Below I have a simple example of how Dijkstra’s algorithm works. Node A is the initial node and F our target node. I have a list of all the nodes on the right side along with their respective distances from the start where bold letters will represent visited nodes and light gray letters will represent unvisited. Our current node is A and the rest of the nodes have been marked a distance of infinity.
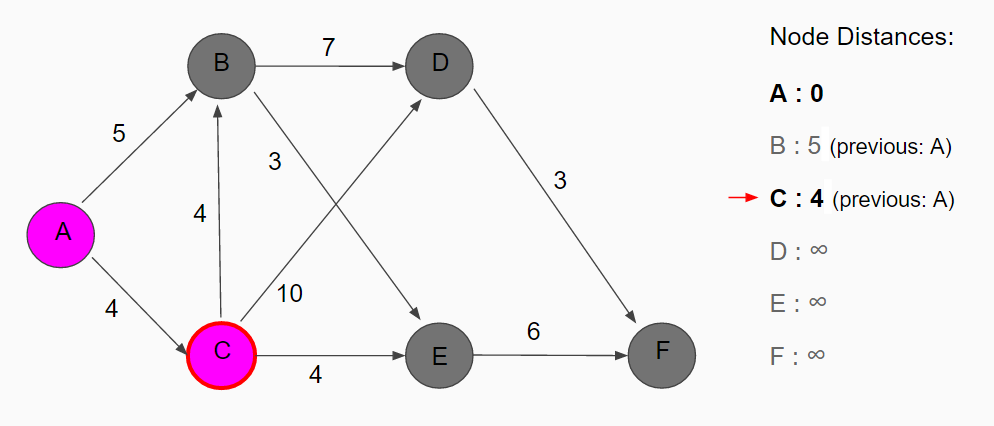
The neighbors to node A are node B with temporary distance 5 and C with temporary distance 4. Node C is the unvisited node with the smallest distance so it is marked as the new current node.
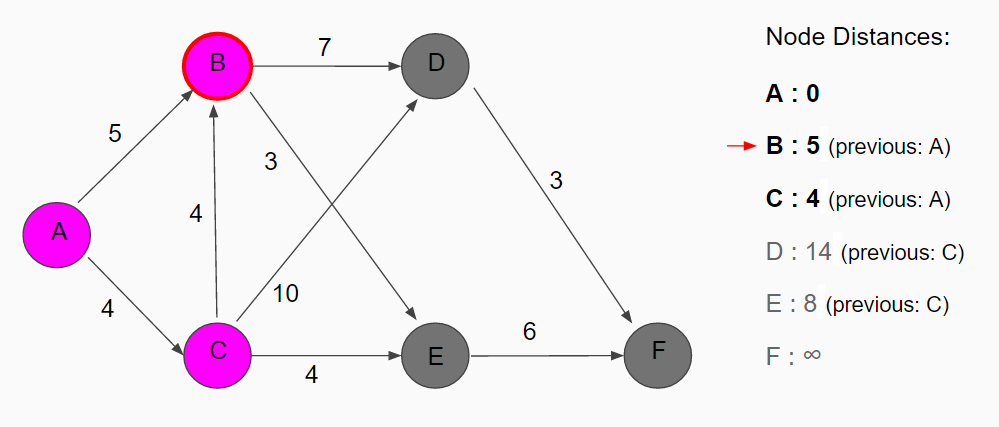
The neighbors from node C are as follows: node B with distance 8 but its temporary distance will not change since the originally assigned distance of 5 is lower; node D with temporary distance 14 (4 + 10); node E with temporary distance 8 (4 + 4). Node B has the smallest value so it is now the current node.
The neighbors to node B are node E with distance 8 (5 + 3) and node D with distance 12 (5 + 7). Node E is set as the current node.
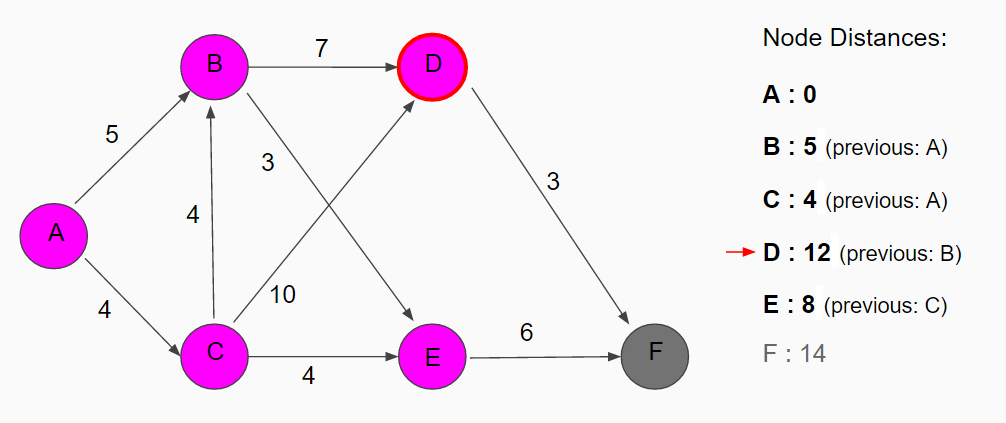
The only neighbor to node E is node F with a distance of 14. Since there is still an unvisited node that has a smaller value, node D, we move to that node to check if there will be a shorter path going through D before ending up at our target node.
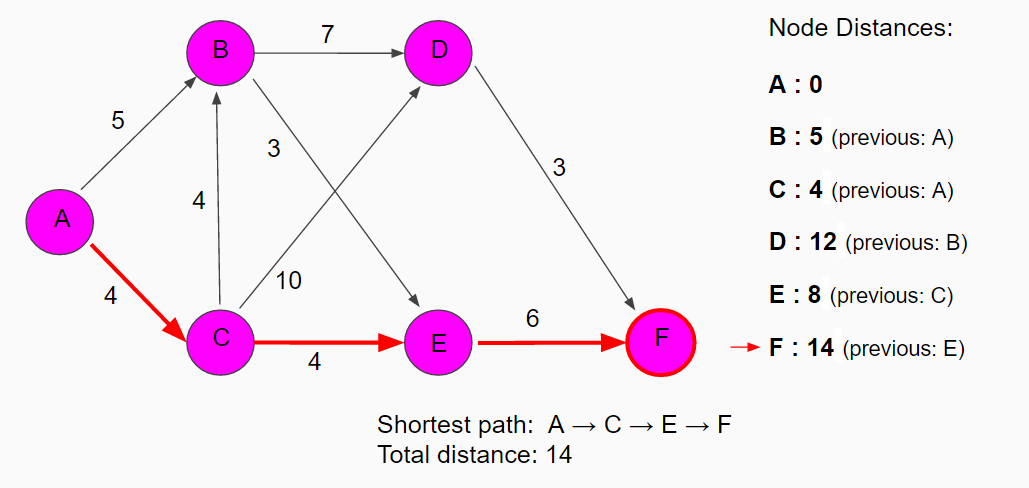
From node D, the temporary distance of node F is 15 (12 + 3). Node F was already assigned a lower temporary value so it remains unchanged and since that is the last node on the unvisited list of node, we move to node F. Node F is our target node so we now know the shortest path through this map has a distance of 14 and to find the path, we backtrack to the initial node: F - E - C - A.
Implementation of Dijkstra’s Algorithm
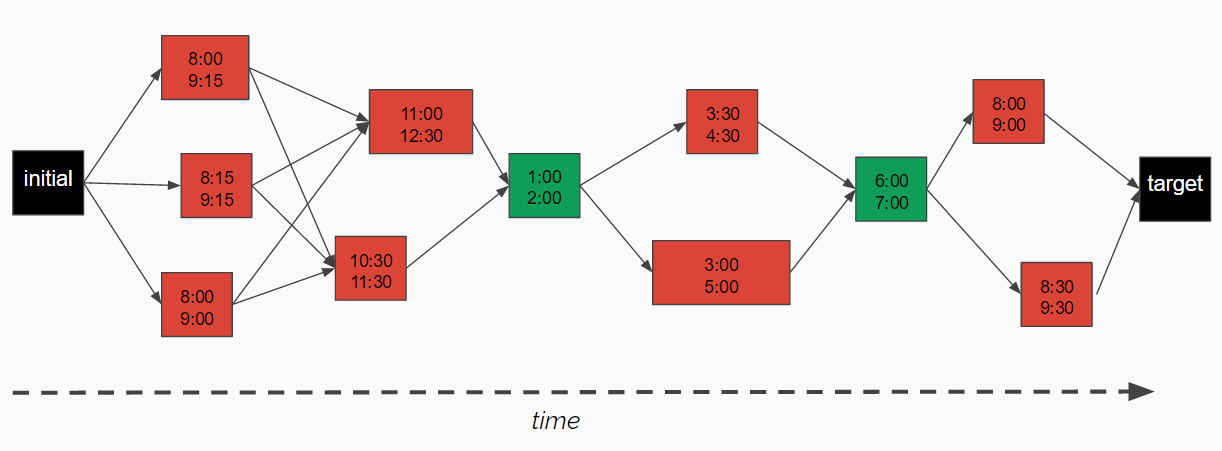
Shortest path algorithms can be used in a variety of applications including traffic simulation, public transportation, and routing protocols for computer communication. For my project with TidyMe, I have each node represent an occurrence arranged chronologically in the map and each edge as the distance value between occurrences. There are no paths between two occurrences overlapping in time because a cleaner can only do one or the other. The initial node is the time at which the cleaner is querying his schedule and the target node is the date one month out.
The edge values are weighted by taking the time between the two occurrences and adding the travel time between the two locations. I wanted the algorithm to prefer using shorter edges, not just the shortest path overall, so to calculate the edge weight I multiplied the time by 10 then took the square root. For example, there are two paths between the two green nodes below. Both paths have an overall distance of 11 but I want the algorithm to choose the path that includes the edge of magnitude 1 as the cleaners want jobs that are grouped together not spaced out with long periods between them. The top path has an overall magnitude of about 13.96 whereas the other path has a magnitude of 13.16 so the algorithm will follow the bottom path.
The result of my algorithm is a list of potential jobs the cleaner can then choose to take. Originally the cleaners were only given the chance to take jobs in their assigned zone but with this algorithm, TidyMe has the option to remove the zone restrictions and use the cleaner’s house as the initial node to find jobs in their area. As this was a project I completed for a course final in November, I did not get the chance to implement the algorithm and test its efficiency although I will update this post after I follow up with TidyMe.
Here is my code using Dijkstra’s algorithm to optimize schedules:

